VISHAL GOSWAMI · BUSINESS CENTRAL SPECIALIST · LONDON

Business Central. From requirements to reliable reporting.

I connect business processes, finance and implementation: translating what teams need into clear requirements, working with implementation partners, and helping people adopt the system.

From routine processing to reconciled, decision-ready reporting. Illustrative figures, no client data.

  1. 01 · The transaction480 units at £12.40 expected cost, all sold for £10,320. The supplier invoices at £12.90, 50p above the PO price, so cost rises by £240 to £6,192. Post the invoice and adjust cost: routine.
  2. 02 · DimensionsBrand, region and department give the business different ways to read the same activity. Set default dimensions on the relevant records, agree priorities and validate the combinations before posting.
  3. 03 · Month-end checkBefore the close, sales by brand is checked against G/L 4000. In this example £54,960 is tagged against £60,000 in the G/L: £5,040 has no brand and one £1,200 entry is on the wrong brand. Both are corrected before reporting, and the defaults are set to Code Mandatory.
  4. 04 · The boardWhat reaches the board is already reconciled: Brand A £31,200, Brand B £20,400, Brand C £8,400, by region. Back what works, renegotiate the range with the supplier, and clear stock that is not moving.
Explore the work

VISHAL GOSWAMI · FINANCE & IMPLEMENTATION

Business Central. From requirements to reliable reporting.

I connect business processes, finance and implementation: translating what teams need into clear requirements, working with implementation partners, and helping people adopt the system.

See my approach ↓

02 / THE TRANSACTION

The stock is right.
The cost catches up.

480 units in, 480 sold. The supplier invoices 50p above the PO price, so cost rises by £240. Post the invoice, adjust cost, and the system gets there. That part is routine.

03 / DIMENSIONS

Set it once.
Every entry carries it.

Brand, region, department: different views of the same business. Set defaults on the relevant records, agree priorities and validate the combinations before posting.

04 / MONTH-END CHECK

Before the close,
check the tags.

Sales by brand should add up to the G/L. Anything untagged or tagged to the wrong brand is corrected before reporting, and the default dimension is set so it can’t post blank again.

05 / THE BOARD

Checked data.
Better decisions.

Which brand sells where, what moves and what sits still. Back what works, renegotiate the range with the supplier, and clear stock before it ties up more cash.

THE WORK BEHIND THE REPORT

Understand the business.
Design the system.
Reconcile the result.

RECEIVE480 EA

£10,320 sales · £5,952 expected cost

ADDITIONAL COST+£240

480 × 50p · actual cost £6,192

SET ONCE, ON THE CARD
Brand
Item, and its brand supplier
Region
Customer
Department
Salesperson

A brand covers a whole range, and usually one supplier agreement. Item by item, you only ever see one product.

MONTH END · SALES BY BRAND vs G/L 4000 · ILLUSTRATIVE
Brand A£26,400
Brand B£18,960
Brand C£9,600
No brand£5,040
Tagged total£54,960
G/L 4000£60,000
Difference£5,040

TWO FINDINGS: UNTAGGED SALES · ONE ENTRY ON THE WRONG BRAND

BOARD VIEW · SALES BY BRAND AND REGION · ILLUSTRATIVE
LondonNorthMidlands
Brand A£14,400£9,600£7,200
Brand B£10,320£6,480£3,600
Brand C£4,800£2,400£1,200

The last thing any business wants is cash sitting on a shelf.

BRAND A · BACK IT

BRAND C · WEAK IN THE MIDLANDS

NOT MOVED THIS QUARTER

Explore the approach ↓Skip to how I work ↓

ILLUSTRATIVE EXAMPLES · NO CLIENT DATA

01 / 05

CHECK THE WORKING

The number has
an entry behind it.

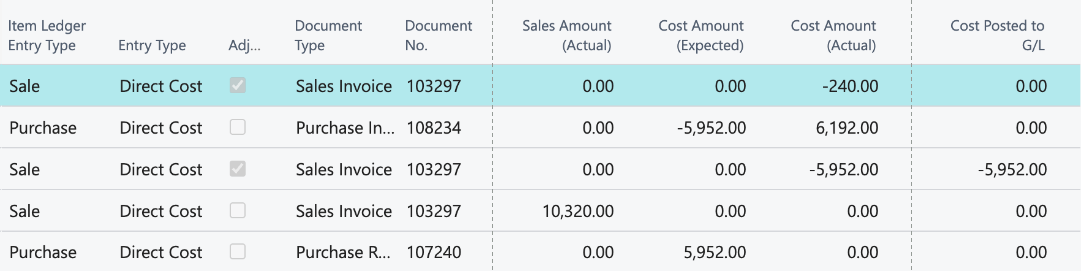
Follow the same £240 in the value entries. Business Central demonstration using the Cronus UK demo company; no client data.

Inspect the value entries£240 adjusted → £240 posted

Read the entries from oldest to newest. The final adjustment has £240 of additional sales cost, with £0 posted to G/L until inventory cost is posted.

Cronus UK demo value entries for FG-2200, including a minus £240 sales cost adjustment with zero cost posted to G/L.
DEMONSTRATION · VALUE ENTRIES BEFORE THE FINAL G/L POSTING
Before posting: additional sales cost minus £240, cost posted to G/L zero.
BEFORE · THE ADDITIONAL COST HAS NOT REACHED G/L
After posting: additional sales cost minus £240 and cost posted to G/L minus £240.
AFTER · THE SAME COST IS POSTED

Sales £10,320 − actual cost £6,192 = gross profit £4,128 (40.00%). VAT excluded. Posting behaviour depends on the Business Central configuration. Intermediate animated amounts are a visual explanation, not separate ledger entries.

HOW I WORK

Find the cause.
Defend the number.

Three things I’ve learned from the finance side of Business Central, mostly the hard way. Each one started as a post on LinkedIn.

01 / BEFORE GO-LIVE

CHART OF ACCOUNTS · DIMENSIONS · REPORTING

Only you know
your business.

THE PROBLEM
Your partner asks you to approve the chart of accounts. You trust them and say yes. Then the reports don’t match, dimensions are missing, and you’re rebuilding while the business is already running.
WHAT I DO FIRST
Map every report leadership actually needs. Build dimensions around how the business actually works. Get finance and leadership aligned before IT touches anything.
MY VIEW
The consultant’s job is to implement Business Central. Your job is to make sure it works for your business. Those are not the same thing.

02 / SYSTEM DESIGN

POSTING GROUPS · GEN. BUSINESS × GEN. PRODUCT

Least exciting.
Most important.

THE PROBLEM
Too coarse and your P&L can’t answer anything useful. Too detailed and nobody can maintain it. You find out two years in, and by then fixing it means reposting history.
WHAT GOOD LOOKS LIKE
Business and product posting groups work as a matrix, so the same laptop sold online and through a shop can land in different revenue accounts. Channel-level numbers without forty more accounts, and margin that is real at the invoice, not at month-end.
MY VIEW
An afternoon workshop that quietly decides what your finance team can see for the next five years.

03 / THE GAP

SPREADSHEETS · FREE OFFLINE TOOLS

A spreadsheet costs nothing.
A system costs £40,000.

THE PROBLEM
One spreadsheet on a shared drive, four people in it, and every week someone loses a morning’s work. Everyone knows it’s risky. Nobody can justify £40k to fix one process.
WHAT I BUILT
I’m not a developer. I described the process to an AI, told it what kept going wrong, and had a working tool in two days. Two are free here: they replace the shipment tracker and the supplier invoice log, saved on the drive you already use. Try them
MY VIEW
The limit, honestly: they work for a handful of people. If forty need them at once, go and buy a real system.
Vishal Goswami, Business Central specialist in London

ABOUT · VISHAL GOSWAMI

From accounting into the systems underneath it.

More than ten years in finance: audit and internal audit in India, then UK finance teams since 2021. Today I work in Business Central every day, from the finance seat.

My implementation experience comes from inside the business: working closely with teams to understand existing processes, define how they should work in Business Central, and turn those needs into clear requirements for the implementation partner.

My work covers finance requirements, chart of accounts and posting groups, dimensions, migration and reconciliation, testing, reporting and employee training.

Get the design right before go-live, not discover the gaps once the business depends on it.
  1. Understand the process
  2. Validate the design
  3. Prepare the people

COMPARE NOTES

Let’s compare
notes.

Working through a Business Central implementation, a reporting challenge or a process that needs rethinking? Let’s exchange perspectives.